other
  • How to test an NTC thermistor with a multimeter
    September 05, 2026 How to test an NTC thermistor with a multimeter
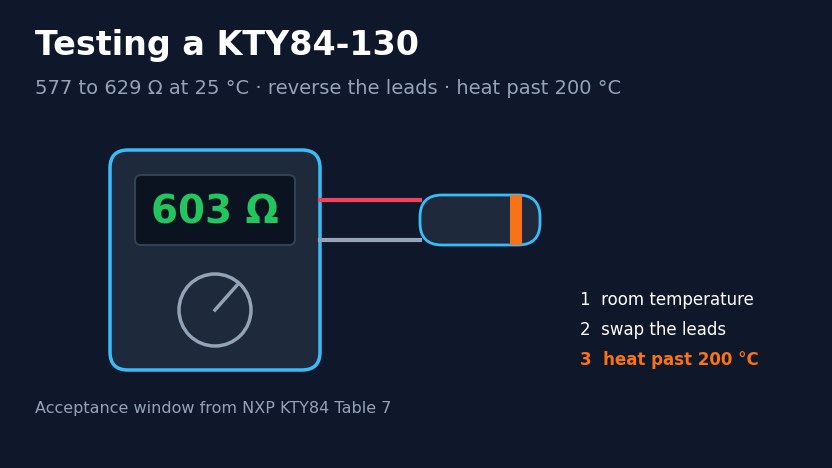
    Set the meter to ohms, disconnect at least one lead of the thermistor, and measure at room temperature. A healthy NTC reads close to its rated R25. Then warm it and watch the reading fall, or chill it and watch the reading rise. An open circuit, a near short, or a reading that does not move with temperature means the part has failed. That answers the question. What follows is how to know what “close to R25” should be for your specific part, why a room-temperature check passes a drifted sensor, and when a measurement taken without unsoldering can be trusted. Published 5 September 2026. Reviewed by the Focusens technical department. Before you probe anything Kill the power and let the equipment sit. Resistance measurement injects the meter's own small current, so a live circuit gives a meaningless reading and can damage the meter. Watch for stored energy. Power supplies, motor drives and anything with a large bulk capacitor hold a charge after the mains is disconnected. Wait for the discharge indication the equipment provides, or check across the bus with the meter on volts before switching to ohms. Note the ambient temperature. Every judgement below is relative to the temperature the thermistor is actually at, not to the number printed on the datasheet. You need a digital multimeter with an ohms range, a way to change the part's temperature by a controlled amount, and the part's R25 and B value. A cup of iced water and a thermometer beats a hot air gun for this, because you know what temperature the part reaches. The procedure Isolate the thermistor. Unplug the connector, or unsolder one leg. Anything in parallel is measured together with the sensor and will drag the reading down. Measure at room temperature. Set the meter to a range above the expected value, touch the probes to the two leads, and let the reading settle. Polarity does not matter. Record the value and the room temperature. Compare against the part's rated R25. A 10 kΩ part at 25 °C reads near 10 kΩ. At 20 °C the same part reads around 12.5 kΩ, so a few degrees of room-temperature difference is not a fault. The next section gives the ratios. Change the temperature and watch the reading move. Put the tip in iced water, or hold it between finger and thumb. Resistance must fall as it warms and rise as it cools, smoothly and within a few seconds for a bare bead. Let it return. Bring the part back to ambient and confirm the reading comes back to where it started. A part that does not return has a thermal or moisture problem even if both individual readings looked reasonable. What “correct” actually looks like “The resistance should change” is not enough to judge a part, because the amount it should change is set by the B value. For a 10 kΩ thermistor with B25/85 = 3988, the Beta equation gives these ratios against its own 25 °C value. Terminology, test methods and the generic requirements for these devices are defined in IEC 60539-1:2022. Chec...
    View More
  • NTC thermistor guide: B value, resistance curve and selection
    September 03, 2026 NTC thermistor guide: B value, resistance curve and selection
    An NTC thermistor is a temperature sensor whose resistance falls as it heats up. NTC stands for negative temperature coefficient. It is made from sintered metal-oxide ceramic, and it is described by two numbers: R25, the resistance at 25 °C, and a B value that sets how steeply the resistance falls. The second of those numbers causes more field problems than any other parameter in thermistor work, because the same physical device can honestly be labelled 3950 or 3988 depending on which two temperatures it was measured between. This guide covers what that means for your calibration, and what to specify so it does not bite you. Published 3 September 2026. Reviewed by the Focusens technical department. Where the resistance curve comes from Thermistor behaviour is not fixed by a single international curve the way platinum RTDs are. Where a PT100 is interchangeable because IEC 60751 defines one relationship for every compliant part, an NTC follows the curve of its own ceramic formulation. The generic requirements, terminology and test methods for these devices sit in IEC 60539-1:2022, edition 4.0, published 15 December 2022, covering directly heated negative temperature coefficient thermistors made from transition metal oxide materials. That difference is the root of everything below. Two thermistors can both be honestly described as “10 kΩ NTC” and follow measurably different curves. The usual working model is the Beta equation: R(T) = R₂₅ · exp[ B · (1/T − 1/298.15) ] with T in kelvin and B in kelvin. Rearranged for temperature: T = 1 / [ 1/298.15 + ln(R/R₂₅) / B ] The table below is that equation evaluated for a 10 kΩ part with B = 3988 K. It is a model output, not a measured datasheet, and the gap between the two is the subject of the next two sections. Temperature Resistance Temperature Resistance −40 °C 416.4 kΩ 50 °C 3,553 Ω −20 °C 107.8 kΩ 60 °C 2,453 Ω 0 °C 34.02 kΩ 70 °C 1,731 Ω 10 °C 20.31 kΩ 80 °C 1,245 Ω 25 °C 10,000 Ω 100 °C 680 Ω 30 °C 8,020 Ω 125 °C 348 Ω 40 °C 5,269 Ω 150 °C 192 Ω Calculated from the Beta equation above, R25 = 10 kΩ, B = 3988 K. Use a manufacturer's own curve data for design work. Why the same part carries different B values B is not a property you can read off a device. It is a number computed from two resistance measurements at two temperatures: B(T₁/T₂) = ln(R₁/R₂) / (1/T₁ − 1/T₂) Change either temperature and the answer changes, because a real thermistor curve is not a perfect exponential. That is why a datasheet B value always carries a subscript naming the pair it was taken between. In the Focusens catalogue alone, parts are specified against five different reference pairs. Reference pair Meaning Example catalogue entries B25/50 measured between 25 °C and 50 °C 2.19 kΩ B25/50:3470, 50 kΩ B25/50:39...
    View More
  • What is an RTD? Resistance temperature detector guide
    September 03, 2026 What is an RTD? Resistance temperature detector guide
    A resistance temperature detector (RTD) is a temperature sensor whose electrical resistance rises predictably as it gets hotter. The sensing element is almost always platinum, and the resistance-to-temperature relationship is fixed by IEC 60751, which references the International Temperature Scale of 1990. A PT100 element reads 100.00 Ω at 0 °C. A PT1000 reads 1000.0 Ω at the same point. Those are the definitions. What decides whether your measurement is any good is the error budget around them, the way an RTD fails, and what has to appear on the purchase order. Published 3 September 2026. Reviewed by the Focusens technical department. How the resistance curve is defined RTDs are interchangeable between manufacturers because the curve is standardised rather than proprietary. IEC 60751:2022, edition 3.0, published 27 January 2022, specifies the resistance versus temperature relationship for industrial platinum resistance thermometers and platinum temperature sensors, referred to the International Temperature Scale of 1990. The metrological basis for that scale is documented in the BIPM's Guide to the Realization of the ITS-90, chapter 5, Platinum Resistance Thermometry. Two equations do the work. Above 0 °C: R(t) = R₀ · [1 + A·t + B·t²] Below 0 °C, a third term is added: R(t) = R₀ · [1 + A·t + B·t² + C·(t − 100)·t³] with A = 3.9083 × 10⁻³ °C⁻¹, B = −5.775 × 10⁻⁷ °C⁻², and C = −4.183 × 10⁻¹² °C⁻⁴. R₀ is the resistance at 0 °C, so 100 Ω for a PT100 and 1000 Ω for a PT1000. Everything in the tables below comes from those equations, and you can reproduce any value in a spreadsheet. Temperature PT100 PT1000 Slope at that point −200 °C 18.52 Ω 185.2 Ω 0.432 Ω/°C 0 °C 100.00 Ω 1000.0 Ω 0.391 Ω/°C 100 °C 138.51 Ω 1385.1 Ω 0.379 Ω/°C 200 °C 175.86 Ω 1758.6 Ω 0.368 Ω/°C 400 °C 247.09 Ω 2470.9 Ω 0.345 Ω/°C 600 °C 313.71 Ω 3137.1 Ω 0.322 Ω/°C 850 °C 390.48 Ω 3904.8 Ω 0.293 Ω/°C Values calculated from the IEC 60751 coefficients above. The slope column is the one people skip. The familiar 0.385 Ω/°C figure is an average across 0 to 100 °C, not a constant, and real sensitivity falls by about a quarter between the ice point and 850 °C. A single-multiplier conversion drifts noticeably above roughly 150 °C. Full lookup values for both PT100 and PT1000 are in the complete resistance table. Platinum, nickel and copper elements Platinum dominates because its resistance-temperature behaviour is repeatable over a wide span and it resists contamination. Nickel and copper elements exist and are cheaper, with narrower usable ranges. Within platinum, the choice is nominal resistance and construction. PT100 PT1000 Resistance at 0 °C 100.00 Ω 1000.0 Ω Sensitivity, 0 to 100 °C average 0.385 Ω/°C 3.85 Ω/°C Temperature error per 1 Ω of lead resistance about 2.6 °C about 0.26 °C Power dissipated at 1 mA excitation 0.1 mW 1.0 mW Usual wiring 3-wire or 4-wire 2-wire is workable Common construction wire wound and thin film mostly thin film Both share the same curve shape and the sam...
    View More
  • PT100 resistance table: full chart (-200 to 850 °C) per IEC 60751
    August 14, 2026 PT100 resistance table: full chart (-200 to 850 °C) per IEC 60751
    A PT100 reads 100.00 Ω at 0 °C and 138.51 Ω at 100 °C, an average slope of 0.385 Ω per °C. The tables below give every 10 °C step from -200 to 850 °C, calculated from the Callendar-Van Dusen equation per IEC 60751 / DIN EN 60751. Use the interactive converter for 1 °C steps or fractional temperatures, or download the full CSV dataset. What the numbers mean A PT100 is a platinum resistance temperature detector with nominal resistance R0 = 100.00 Ω at 0 °C. Its temperature coefficient α is 0.003851 °C⁻¹. Every PT100 follows the same normalized platinum curve as a PT1000, scaled by a factor of 10. Reference point PT100 resistance PT1000 resistance Sensitivity ΔR/ΔT -200 °C (cryogenic limit) 18.52 Ω 185.20 Ω ~0.431 Ω/°C 0 °C (ice point) 100.00 Ω 1000.00 Ω 0.385 Ω/°C 100 °C (steam point) 138.51 Ω 1385.06 Ω 0.375 Ω/°C 850 °C (upper limit) 390.48 Ω 3904.81 Ω ~0.247 Ω/°C Complete PT100 resistance table The tables below show resistance values in 10 °C steps across the entire standardized range from -200 to 850 °C. Read the row for the tens digit and the column for the ones digit. Negative range, -200 to -10 °C °C 0 -1 -2 -3 -4 -5 -6 -7 -8 -9 -200 18.52 — — — — — — — — — -190 22.83 22.40 21.97 21.54 21.11 20.68 20.25 19.82 19.38 18.95 -180 27.10 26.67 26.25 25.82 25.39 24.97 24.54 24.11 23.68 23.25 -170 31.34 30.91 30.49 30.07 29.64 29.22 28.80 28.37 27.95 27.52 -160 35.54 35.12 34.70 34.28 33.86 33.44 33.02 32.60 32.18 31.76 -150 39.72 39.31 38.89 38.47 38.05 37.64 37.22 36.80 36.38 35.96 -140 43.88 43.46 43.05 42.63 42.22 41.80 41.39 40.97 40.56 40.14 -130 48.00 47.59 47.18 46.77 46.36 45.94 45.53 45.12 44.70 44.29 -120 52.11 51.70 51.29 50.88 50.47 50.06 49.65 49.24 48.83 48.42 -110 56.19 55.79 55.38 54.97 54.56 54.15 53.75 53.34 52.93 52.52 -100 60.26 59.85 59.44 59.04 58.63 58.23 57.82 57.41 57.01 56.60 -90 64.30 63.90 63.49 63.09 62.68 62.28 61.88 61.47 61.07 60.66 -80 68.33 67.92 67.52 67.12 66.72 66.31 65.91 65.51 65.11 64.70 -70 72.33 71.93 71.53 71.13 70.73 70.33 69.93 69.53 69.13 68.73 -60 76.33 75.93 75.53 75.13 74.73 74.33 73.93 73.53 73.13 72.73 -50 80.31 79.91 79.51 79.11 78.72 78.32 77.92 77.52 77.12 76.73 -40 84.27 83.87 83.48 83.08 82.68 82.29 81.89 81.50 81.10 80.70 -30 88.22 87.83 87.43 87.04 86.64 86.25 85.85 85.46 85.06 84.67 -20 92.16 91.77 91.37 90.98 90.59 90.19 89.80 89.41 89.01 88.62 -10 96.09 95.69 95.30 94.91 94.52 94.12 93.73 93.34 92.95 92.55 Positive range, 0 to 850 °C °C 0 1 2 3 4 5 6 7 8 9 0 100.00 100.39 100.78 101.17 101.56 101.95 102.34 102.73 103.12 103.51 10 103.90 104.29 104.68 105.07 105.46 105.85 106.24 106.63 107.02 107.40 20 107.79 108.18 108.57 108.96 109.35 109.73 110.12 110.51 110.90 111.29 30 111.67 112.06 112.45 112.83 113.22 113.61 114.00 114.38 114.77 115.15 40 115.54 115.93 116.31 116.70 117.08 117.47 117.86 118.24 118.63 119.01 50 119.40 119.78 120.17 120.55 120.94 121.32 121.71 122.09 122.47 122.86 60 123.24 123.63 124.01 124.39 124.78 125.16 125.54 125.93 126.31 126.69 70 127.08 127.46 127.84 128.22 12...
    View More
  • The Cold Chain Behind the Stadium Beer Line
    July 25, 2026 The Cold Chain Behind the Stadium Beer Line
    Direct answerA cold chain is a sequence of custody handoffs, and temperature sensing exists at each one to prove the product never left its band. The chain fails where custody changes — not in the middle of a well-instrumented cold store. A stadium sells beer at 3 °C to seventy thousand people across four hours. Getting there means a chain of refrigerated steps stretching back weeks, each one owned by a different party, each handoff a place where responsibility — and temperature — can be dropped. The engineering lesson generalises well beyond drinks. Every cold chain fails the same way: not in the middle of a monitored space, but at the moments when the product moves between owners and nobody is measuring. Six handoffs, six sensing problems Custody steps and what each one needs from a sensor Step What must be known Sensing approach Why Production / conditioning Process temperature, tightly held Immersion probe, platinum or precision NTC Control point; accuracy is the product spec Cold store Space temperature, many points Multi-drop digital (1-Wire) Twenty points, one data line — wiring is the cost driver, not accuracy Loading dock Exposure time and peak Logger / portable probe The classic failure point — nobody owns the pallet on the dock Transport Continuous record over hours Logger, battery-driven Evidence, not control; low power is the constraint Venue cellar Space and coil temperature NTC probe + defrost sensing Control and defrost termination Dispense line Line temperature at delivery Pipe-clamp NTC Non-invasive on a wetted line; you cannot break into a product line Notice the pattern. Accuracy dominates at the ends — where the product is made and where it is delivered. In the middle, topology and evidence dominate. That distinction should drive the component choice, and it usually doesn't. The cold store: why 1-Wire wins here A cold store needs many points and modest accuracy. That is precisely the DS18B20's case. From the Focusensing FST DS18B20 datasheet: 9–12 bit user-selectable resolution, ±0.5 °C from −10 to +85 °C, 1-Wire open-drain interface, 12-bit conversion in 750 ms maximum, supply 3.0–5.5 V. (Focusens FST DS18B20 datasheet.) The number that matters is not the ±0.5 °C. It is the word open-drain. Many addressable sensors share one data line — twenty probes, one pin, one cable run. Where the wiring is the expensive part and ±0.5 °C sits comfortably inside the product's tolerance band, that topology is worth more than accuracy you would never act on. 5 mm tubular DS18B20 probe — space temperature Waterproof tubular DS18B20 probe — washdown areas Thread-mount DS18B20 probe — where it must not move Flange-mount DS18B20 · all digital assemblies Choosing between a digital probe and a plain thermistor for a pack of points? DS18B20 vs NTC thermistors works the comparison through in detail. The evaporator and the defrost problem A refrigeration evaporator ices up. Ice insulates, capacity falls, the system works harder to do less. So it def...
    View More
  • Pipe-Strap vs Clamp-On Sensor: The Buyer's Call
    July 22, 2026 Pipe-Strap vs Clamp-On Sensor: The Buyer's Call
    Direct answerUse a strap-mount sensor when pipe diameter varies across the job and you want one part number to fit all of it. Use a spring clamp when a technician will remove and refit the sensor repeatedly. Use a threaded probe when the reading must be the fluid, not the pipe. "Pipe-strap" and "clamp-on" get used interchangeably in catalogues, which is unhelpful, because the difference is mechanical and it decides how the sensor fails. Both press a sensing element against a pipe from outside. What differs is what supplies the force — and force, contact area and repeatability are the whole game in surface sensing. The three mounting families Mounting method, and what each one is actually good at Strap-mount Spring clamp Threaded / immersion Force source Tensioned strap, ratchet-locked Pre-formed spring steel Thread + seal Pipe size range Wide — one part covers a range Narrow — sized per diameter Fixed fitting Refit by hand Possible; tension is operator-dependent Designed for it Needs draining Contact repeatability Depends on who fitted it High — the spring sets the force Not applicable Measures Pipe surface Pipe surface The medium Break into the pipe? No No Yes The buyer's question is rarely "which is better". It is "which one is still reading correctly in three years" — and there the answers diverge sharply. Three failure modes nobody puts on a datasheet 1 · Tension decay A strap is only as good as the force still in it. Thermal cycling and vibration walk a smooth strap loose. This is exactly why the TPE strap on the Focusensing pipe-clamp carries locking holes on a 4.5 mm pitch — ratchet geometry that holds tension once seated instead of relying on friction. (Pipe-strap product documentation.) If you are evaluating a smooth-band competitor, that is the question to ask. 2 · The air gap you paid to avoid Specify a copper-capped tip for its thermal path, then mount it over a weld seam or a burr, and you have bought a copper cap and installed an air gap. Contact is not binary. A copper tip held 0.3 mm off the pipe performs like a polymer tip and costs more. The general practice here is covered properly in Thermistor Mounting 101 — best practices for accurate temperature measurement. If you fit sensors, read that one before this one. 3 · Wrong-diameter creep A strap sized for 35 mm on a 12 mm line contacts the pipe on a tangent — a line, not a patch. It reads, it just reads slowly and toward ambient. Spring clamps fail the opposite way: right diameter, perfect contact, wrong part on the next pipe size, so the store carries five SKUs. The size question, with real numbers The integrated TPE strap is 110 ± 10 mm long and 7.0 ± 0.2 mm wide, covering pipe outer diameters up to about 35 mm. Past that, a buckle-on extension strap extends the range — that is the extension-chain version. Probe nose length is 6.0 ± 0.5 mm. (Pipe-strap product documentation.) This is where strap-mount wins commercially, and it has nothing to do with physics: one part number co...
    View More
  • How Pipe-Clamp Sensors Keep a 35°C Stadium Cool
    July 17, 2026 How Pipe-Clamp Sensors Keep a 35°C Stadium Cool
    Direct answerA pipe-clamp (clamp-on) temperature sensor measures pipe surface temperature without cutting into the line. In stadium cooling it sits on chilled-water and refrigerant pipes, feeding the controllers that hold safe indoor temperatures when it is 35 °C outside. Seventy thousand people in an enclosed bowl on a 35 °C afternoon is a cooling problem measured in megawatts. The equipment that solves it — chillers, pumps, air handlers, kilometres of insulated pipe — is photographed constantly and understood rarely. The component that decides whether any of it works is none of those things. It is a black plastic lozenge strapped to a pipe in a plant room, and it costs less than the bolts holding the chiller down. Pull that sensor off its pipe and the chiller controlling the loop goes blind. A blind chiller is not a stopped chiller — that would at least be obvious. It is a chiller that keeps running against a number that is wrong, burning money quietly for the length of the tournament. This article walks the cooling chain from plant room to seat, and shows where clamp-on sensing decides the outcome. The number that makes sensor accuracy a budget line Start with a figure most fans never hear. Chiller efficiency moves by roughly 2 percent for every 1 °F of change in chilled-water supply temperature. FacilitiesNet puts it at approximately 2 percent per degree of supply-temperature increase; Quest Design Group gives the same rule of thumb and notes paybacks under a year on larger plants. Georgia Power, quoted by BuildingIQ, is more conservative — about 1 percent per °F above 42 °F in centrifugal machines — with other sources landing between 1.5 and 2 percent. (FacilitiesNet; Quest Design Group; BuildingIQ citing Georgia Power.) Call it 1–2 percent per degree and the conclusion holds either way. A pipe sensor reading 2 °F low tells the chiller to over-cool by 2 °F. At 1–2% per degree that is roughly 2–5% added to compressor energy — every hour, for the whole event. The cheapest part in the loop sets the ceiling on the most expensive one's efficiency. This is not a rounding error dressed up as a story. It is the reason instrumentation appears in the standards at all. ASHRAE's Guideline 22, which defines how to instrument a central chilled-water plant, makes the same argument in standards language: the quality and installation of temperature instrumentation bounds how accurately plant efficiency can be known or controlled. (ASHRAE Guideline 22, Instrumentation for Monitoring Central Chilled-Water Plant Efficiency.) You cannot optimise what you cannot measure, and you cannot measure better than your sensor and its mounting allow. Walking the cooling chain The chiller The chiller makes cold water, typically 6–7 °C (42–45 °F). It controls itself against two measurements above all others: water leaving, water returning. Those two normally use platinum RTDs — PT100 or PT1000 — because platinum drifts little and ...
    View More
  • The Cold Chain Behind the Stadium Beer Line
    July 03, 2026 The Cold Chain Behind the Stadium Beer Line
    Direct answerThe cold chain feeding a stadium runs on NTC thermistors at every stage — refrigerated trucks, walk-in coolers, ice machines and chilled beverage lines. They hold food below 40°F (4°C) and drinks at serving temperature, and trigger defrost and alarms when readings drift. A sold-out stadium is a catering operation the size of a small town, and almost everything it serves has to stay cold from the moment it leaves a warehouse. Break the chain anywhere — a reefer that warms in traffic, a walk-in whose coil iced over, a beer line that lost its chill on the last twenty feet to the tap — and the failure shows up in a warm drink or, worse, a sick fan. The thing holding the chain together is unglamorous: a network of NTC thermistors. The line that turns temperature into a legal requirement Food safety runs on a hard number. The US FDA Food Code treats roughly 40°F to 140°F (4°C–60°C) as the "danger zone" where bacteria multiply fastest, so perishable food must be held below 40°F. (US FDA Food Code.) That single threshold is why refrigeration isn't comfort engineering here — it's compliance, logged and audited, and the log comes from sensors. Stage by stage Cold-chain stages, target temperatures, and the sensing at each. Stage Target Sensing role Sensor Refrigerated truck 34–40°F Coil + cargo control, logging Sealed NTC Walk-in cooler 34–40°F Setpoint + defrost termination NTC ×2 roles Walk-in freezer 0°F / −18°C Setpoint + defrost NTC Ice machine ~32°F / 0°C Harvest/cycle NTC, accuracy near 0°C Beverage line 36–41°F Serving-temp check Pipe-clamp NTC The two-sensor trap in every walk-in A walk-in cooler needs two NTC sensors doing different jobs, and confusing them is a classic field fault. One holds the box setpoint. The other sits on the evaporator coil and ends the defrost cycle once the ice clears. Get the defrost sensor wrong and you fail one of two ways: the coil never fully defrosts and slowly loses capacity, or it defrosts too long and warms the whole box past that 40°F line. The ASHRAE Refrigeration Handbook treats defrost control as a discipline of its own for exactly this reason. The last twenty feet: the beer line Draft beer is the cold chain's final pipe problem. Product travels from a cold store through long lines kept cold by glycol or a remote chiller, and it has to arrive at the tap at serving temperature — too warm and it foams and goes flat. Because line diameters vary across a venue, this is textbook territory for an adjustable pipe-clamp sensor like the sealed MFE1 overmoulded NTC; the strap-vs-clamp choice is in Article 2. What a cold-chain sensor must survive Condensation and washdown — IP67/IP68 sealing stops the drift that kills unsealed parts; the construction is in our TPE-overmoulding guide. Accuracy near 0°C — the whole chain lives near freezing, so a tight, interchangeable NTC matters more than wide-range accuracy. Fast response — tight defrost and serving control want a lo...
    View More
1 2 3 ... 12

A total of 12 pages

Leave A Message
Any information wanted ? Leave us a message here please.

Home

Products

about

contact